From Info-Overload to Intel: I Built a CTI 'Brain' to Hunt Threats
From Info-Overload to Intel: I Built a CTI “Brain” to Hunt Threats
In cybersecurity, we aren’t drowning in threats; we’re drowning in data.
The modern SOC (Security Operations Center) analyst’s day begins not with a coffee, but with a data deluge: dozens of RSS feeds, hundreds of new events on the MISP platform, and a constant stream of SIEM alerts. It’s “infobesity,” and it’s paralyzing.
The real problem? This data is siloed. A malicious IP address from a blog post isn’t linked to a MISP event, which isn’t linked to the threat actor (like APT29) using it.
The result is a day spent on “copy-paste security.” The analyst toggles between 10 browser tabs, manually enriching every single indicator on VirusTotal, AbuseIPDB, OTX, and more. It’s slow, exhausting, and inefficient.
During my recent internship, I was given a mission: end this chaos.
My project was to design and build a centralized Cyber Threat Intelligence (CTI) Platform. This wasn’t just another aggregator; it was a “brain” designed to collect, enrich, and—most importantly—correlate data automatically, turning all that noise into actionable intelligence.
Here’s how I built it.
Part 1: The Foundation (The Tech Stack)
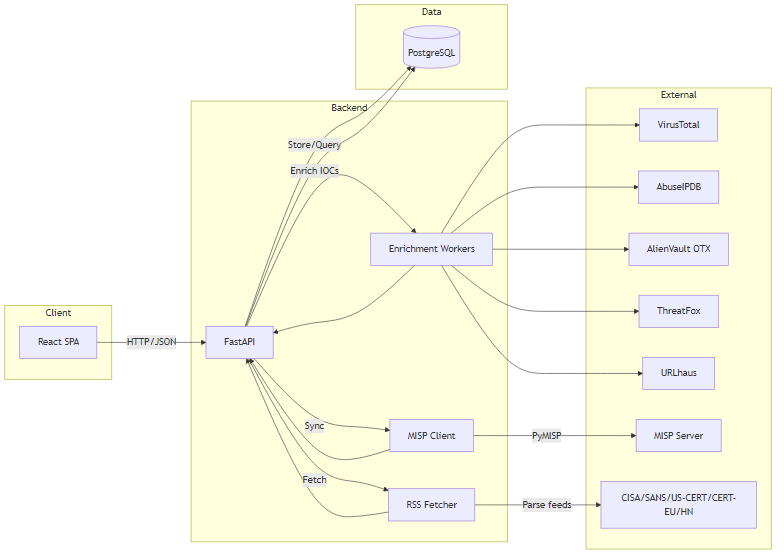
To build a responsive and powerful system, I needed a modern, decoupled architecture. I chose a 3-tier stack, fully containerized:
- Frontend: A fluid and dynamic Single Page Application (SPA) built in React 19, using Hooks for state management and Chart.js for data visualization.
- Backend: The reactor core. I chose FastAPI (Python) for its raw performance and native handling of asynchronicity. This was the secret weapon for managing dozens of API calls without making the user wait.
- Database: PostgreSQL, for its robustness and ability to handle complex relational queries.
- Infrastructure: The entire application is “packaged” in Docker (using docker-compose) and automatically tested by CI/CD pipelines in GitHub Actions.
Part 2: The Async Enrichment Engine (Getting Context in 2 Seconds)
The first win was centralizing data (parsing RSS feeds with feedparser and integrating MISP events with PyMISP). But the real value comes from enrichment.
When an analyst sees an IP, they need to know instantly if it’s bad.
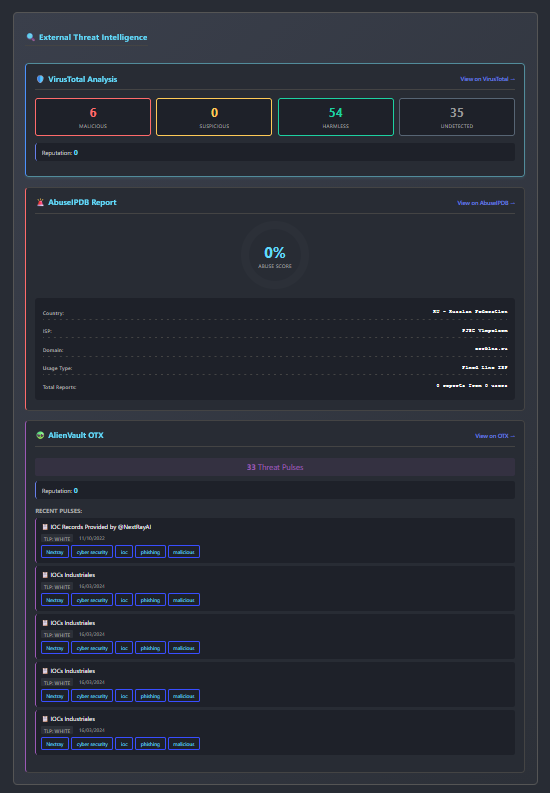
To solve this, I built an asynchronous enrichment engine. When an analyst clicks an indicator (IP, hash, domain…), the FastAPI backend doesn’t call the APIs one by one. It uses asyncio and httpx to launch 5+ API calls in parallel:
- VirusTotal
- AbuseIPDB
- AlienVault OTX
- ThreatFox
- URLhaus
The result: Instead of waiting 10 seconds (the sum of all calls), the analyst gets a full report from 5+ sources in under 2 seconds (the time of the slowest API). The information is displayed in clean, clear cards, turning a simple IP into a rich threat profile.
Part 3: “The Brain” (The Actor-to-IOC Correlation)
This is where the project gets really exciting. Having enriched data is good. Knowing who is using it is game-changing.
I implemented what I call “The Brain” of the platform: an automatic correlation engine.
Step 1: Build the Knowledge Base.
First, I wrote a script (populate_mitre.py) that uses pyattck to import the entire MITRE ATT&CK framework into the database. The platform now “knows” every major threat actor (APT29, FIN7, etc.) and all their known Tactics, Techniques, and Procedures (TTPs).
Step 2: Connect the Dots.
Next, I developed a “worker” (link_indicators) that scans all MISP events. When it finds a “galaxy” tag (e.g., misp-galaxy:threat-actor=”APT29”), it doesn’t just display it. It:
- Identifies the “APT29” actor in the database (even handling aliases like “Cozy Bear”).
- Gathers all other indicators (IPs, domains, hashes) from that same MISP event.
- Creates a Many-to-Many link in the database between “APT29” and every single one of those indicators.
The impact is massive. An analyst can now go to the “APT29” profile page and see a consolidated list of every IOC ever attributed to them, compiled from hundreds of different MISP events. The threat is no longer just a list of IPs; it has a name and a face.
Part 4: The AI Co-pilot and Visuals (Making Data Usable)
All this data needs to be digestible. I focused on two key features for the analyst.
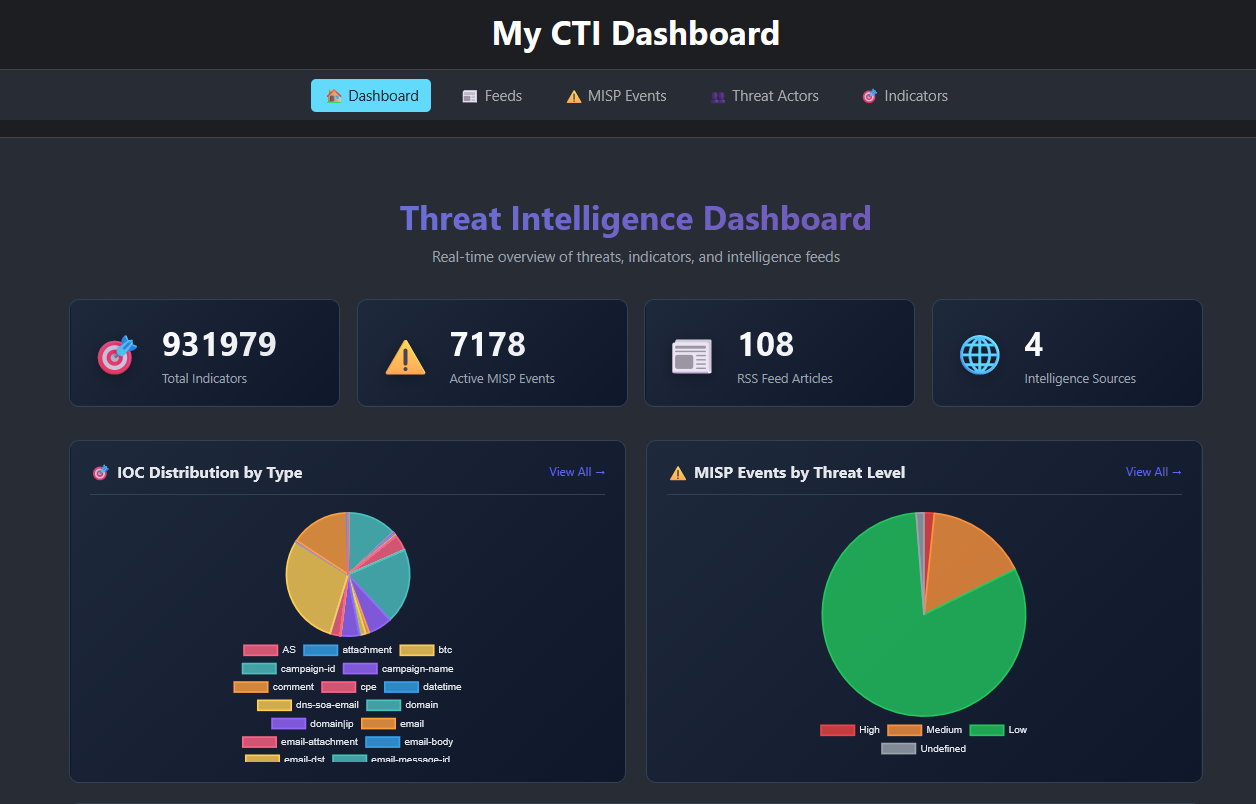
1. The Dashboard (Situational Awareness)
The homepage (DashboardPage.js) provides a “macro” view of the threat landscape. It uses Chart.js to show real-time graphs:
- IOC Distribution: Are we seeing more phishing (domains) or malware (hashes)?
- MISP Threat Levels: Is the overall global alert level rising today?
- Source Activity: Which CTI feeds are providing the most intel?
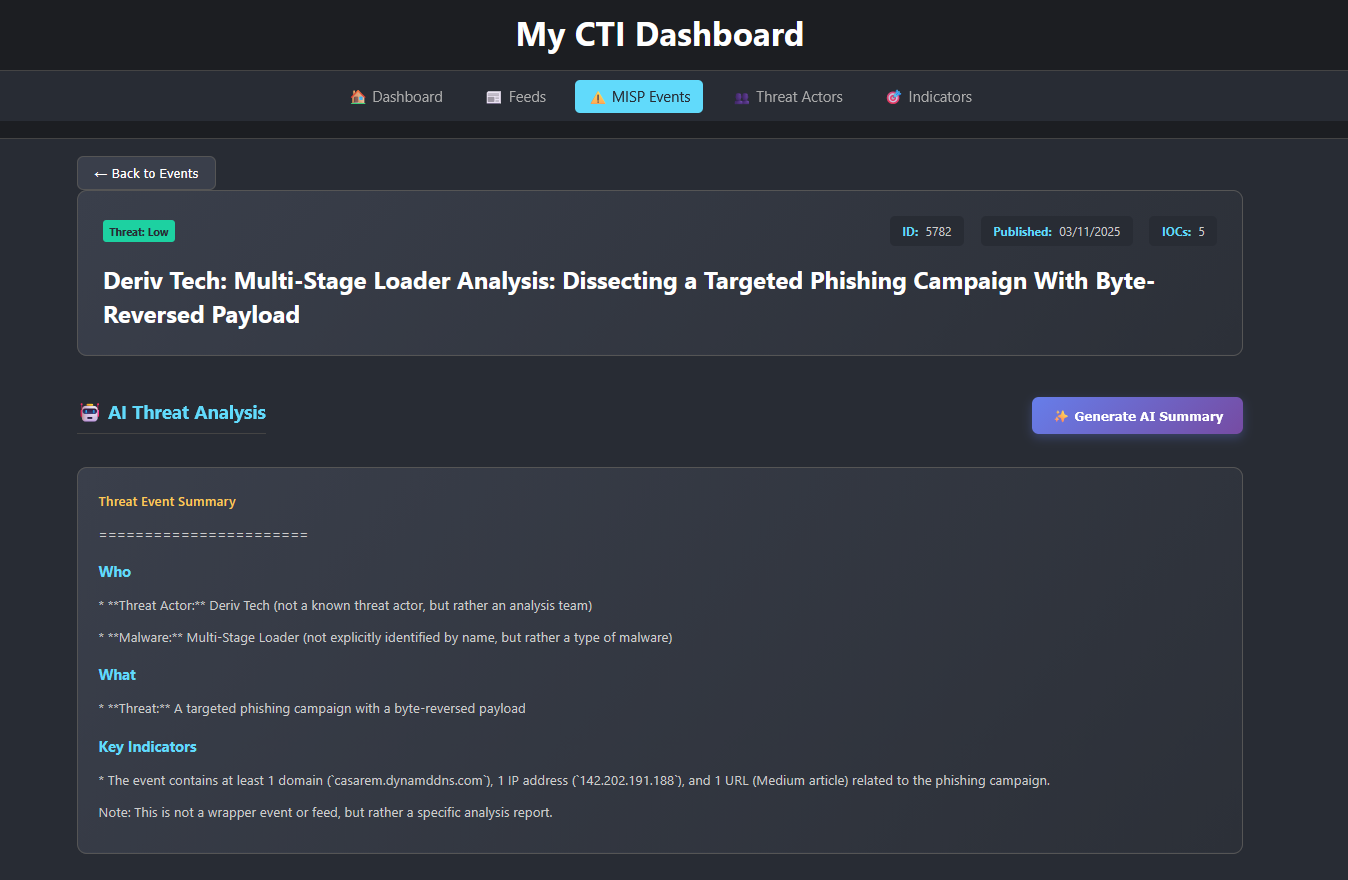
2. The AI Summary (Decision Support)
A single MISP event can contain 500+ indicators. It’s unreadable. To fix this, I integrated the GROQ API (an ultra-fast LLM).
With one click on “Generate AI Summary,” the backend sends a specific prompt I engineered: (“You are a senior CTI analyst. Summarize this MISP event in 3 bullet points: 1. What is the threat? 2. Who is the actor? 3. What are the key indicator types?”).
In seconds, the AI “reads” the event and gives the analyst a 3-point summary. The manual triage of 500 indicators is done.
Conclusion: From “Data Janitor” to “Threat Hunter”
This project taught me that cybersecurity isn’t just a battle of tools; it’s a war of speed. The team that can process, contextualize, and act on information the fastest, wins.
This CTI Platform transforms the analyst. They are no longer a “data janitor,” spending their day on copy-paste. They become a true “threat hunter,” armed with a platform that provides context, identifies actors, and allows them to focus on what humans do best: making critical decisions.
Check out my CTI platform code: CTI Brain Repo